The SaaS Production Readiness Checklist for Small Teams
A practical SaaS production readiness checklist: repeatable deploys, tested recovery, useful alerts, essential infrastructure, and operating costs.
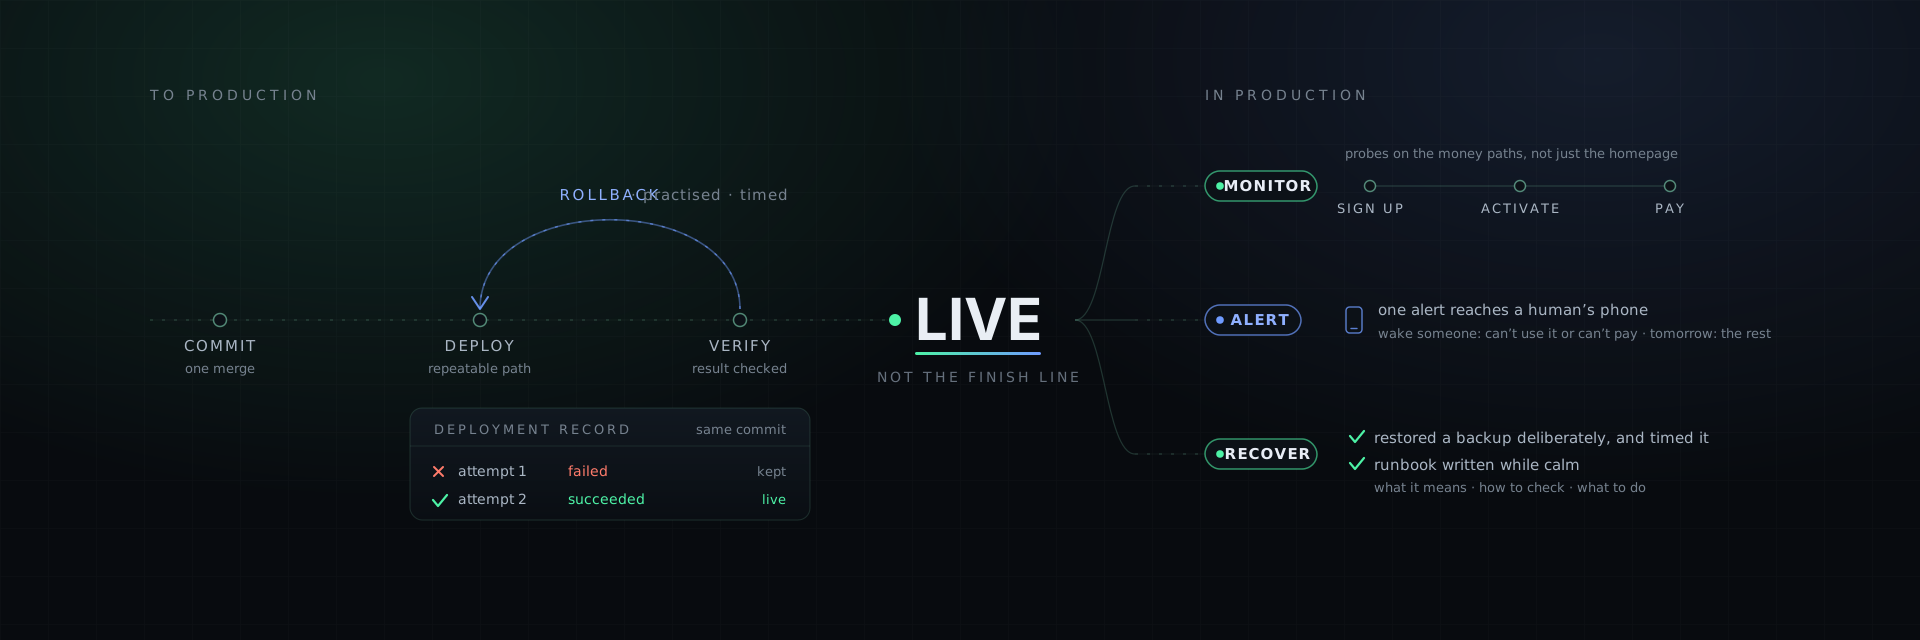
"It's live" is not the finish line. Before customers depend on a SaaS, you need a repeatable deploy, a practiced recovery path, monitoring on the customer journey, and an alert that reaches a responsible human.
This production readiness checklist covers that operational half: how code gets to production safely, how you find out when it breaks, and what infrastructure a small team actually needs. It assumes you have already covered the launch basics, including authentication, secrets, payments, and a real database. Those are in the vibe coder's guide to production.
The production readiness checklist
Use this before real customers depend on you. Everything else in the article explains the checklist.
Deploy
- One command or one merge starts a repeatable deploy
- You have practiced rollback and recorded how long it takes
- Database migrations run automatically and are backward compatible
- Secrets come from a secret store, not the repo, not the CI config
Data
- Automated daily backups
- You have restored one deliberately and timed it
- Recovery objectives match the amount of data the business can afford to lose
Observability
- Errors go to a service you actually check (Sentry or equivalent)
- Uptime checks on the money paths, not just the homepage
- At least one alert reaches a human's phone
- Structured logs you can search by request and tenant without exposing secrets
- Costs are visible, with a billing alarm
Safety
- HTTPS everywhere; enable HSTS only after every required subdomain is ready
- Rate limiting on auth and expensive endpoints
- Dependency vulnerability scanning in CI
- A written answer to "what do I do when it's down at 3am"
If you prioritize only two items today, restore a backup and route one meaningful alert. Those exercises expose gaps while you still have time to fix them.
CI/CD: what to automate first
Continuous integration means every push runs your checks. Continuous deployment means an approved, passing change can ship through a repeatable path. For a small team, both are worth establishing early because ad hoc deploys are harder to reproduce and recover.
A pipeline that's enough:
- On every push: lint, type check, run tests, and build. Keep the feedback fast enough that the team uses it consistently.
- On merge to main: build a versioned artifact, deploy to staging, and exercise the critical paths against real staging.
- To production: automatically if your tests are genuinely trustworthy, or behind one button click if they aren't yet. Both are respectable; deploying from a laptop is not.
Deploy small and often. Small changes are easier to review, diagnose, and reverse than a large batch. Frequency is not the goal by itself; a short, dependable path from change to recovery is.
Migrations are the sharp edge. Application rollback is often easier than schema rollback. Make migrations backward compatible so the previous application version still runs against the new schema. Add before you remove, migrate data separately, and drop the old shape only after no deployed code depends on it. This "expand, migrate, contract" discipline preserves a recovery path.
Blue/green or rolling deploys can reduce downtime and make traffic shifts reversible. Platform behavior varies, so verify what your provider actually does and practice recovery before you need it.
Monitoring: four useful starting signals
It's easy to build a dashboard with forty charts and no idea whether the system is healthy. Start with four signals that cover common failure modes:
- Latency: how long requests take at a high percentile. Averages can hide a slow experience for a meaningful group of users.
- Traffic: requests over time. It gives context to every rate, and an unexpected drop can reveal an outage.
- Errors: failed requests as a proportion of traffic, grouped by path and tenant where safe.
- Saturation: how close the system is to a limit such as CPU, memory, disk, concurrency, or database connections.
Then add the business signals that infrastructure metrics miss: can a user sign up, activate, and pay? Synthetic checks or carefully designed probes can exercise those paths end to end. Tune their frequency and test data so they do not create false customers or charges.
Alerting: the discipline part
Monitoring is data. Alerting is the decision to interrupt a human. Getting this wrong in either direction is expensive.
Alert on symptoms first. A sustained checkout failure rate is closer to customer impact than a single high-CPU reading. Cause metrics still help diagnosis, but they should page someone only when they predict an urgent failure reliably.
Every alert must be actionable. If your response is to look at it and do nothing, delete it. Alert fatigue is not a personality failing; it's the predictable result of alerts that don't matter, and it's how real incidents get missed.
Start with two severities:
- Wake someone up: customers can't use the product or can't pay
- Look at it tomorrow: everything else
Route the first one to a channel that can wake the responsible person. The exact service matters less than tested delivery, escalation, and a backup route.
Write the runbook while you're calm. Three lines per alert: what it means, how to check, what to do. At 3am you will not reason from first principles; you will follow instructions or flail.
Infrastructure: what you actually need
The honest baseline for a SaaS with real customers:
| Piece | What it needs to be |
|---|---|
| Compute | A documented replacement or redundancy strategy that matches your recovery objective |
| Database | Managed storage, automated backups, tested restore, and appropriate point-in-time recovery |
| Static assets | Durable storage and a delivery path appropriate to the traffic |
| Secrets | A managed secret store |
| DNS + TLS | Managed certs with auto-renewal |
| Logs | Aggregated, searchable, access-controlled, and retained for a defined period |
Managed platform versus general cloud is a trade between convenience, control, portability, and operating effort. Compare the full system you need, not the headline compute price. A lower unit price can still cost more once setup, support, and on-call work are included.
Use infrastructure as code for the resources you operate, even on a managed platform. Terraform, CDK, Pulumi, or the platform's own configuration can make the intended environment reviewable and reproducible. Keep credentials and environment-specific secrets outside that code.
What you may not need yet: Kubernetes, microservices, multi-region, or a service mesh. Each can solve real scaling, isolation, or resilience problems, and each adds operating complexity. Start with the simplest architecture that meets your current recovery and capacity requirements, then change it when measured constraints justify the work.
What it costs to keep running
Provider prices and workloads vary too much for a universal monthly total. Build the budget from measurable units:
| Line item | Forecast from |
|---|---|
| Compute | Requests, execution time, memory, redundancy, environments |
| Database | Storage, connections, throughput, backups, recovery window |
| CDN + storage | Stored bytes, requests, and data transfer |
| Monitoring + logs | Events, checks, ingestion, retention, and users |
| Support | Service level and response requirements |
Set budgets and billing alarms before launch, then test who receives them. Runaway queries, retry loops, and forgotten resources are easier to correct when the cost signal arrives early.
Also budget attention. Dependency updates, capacity changes, recovery exercises, alert tuning, and incidents arrive throughout the product's life. Track that time. It is part of the infrastructure cost even when no provider includes it on an invoice.
What this looked like at ListMyCar
ListMyCar keeps its application and AWS infrastructure definition in its own repository. GitHub Actions owns the delivery workflow; Solo dispatches that existing workflow, follows the exact commit being released, reads the release record, and verifies the result. The operating layer coordinates the release without becoming the runtime.
The deployment history below shows a failed attempt beside a successful deployment for the same commit. Keeping both matters: a green final state tells you what is live, while the failed attempt preserves the evidence needed to improve the path that got it there.
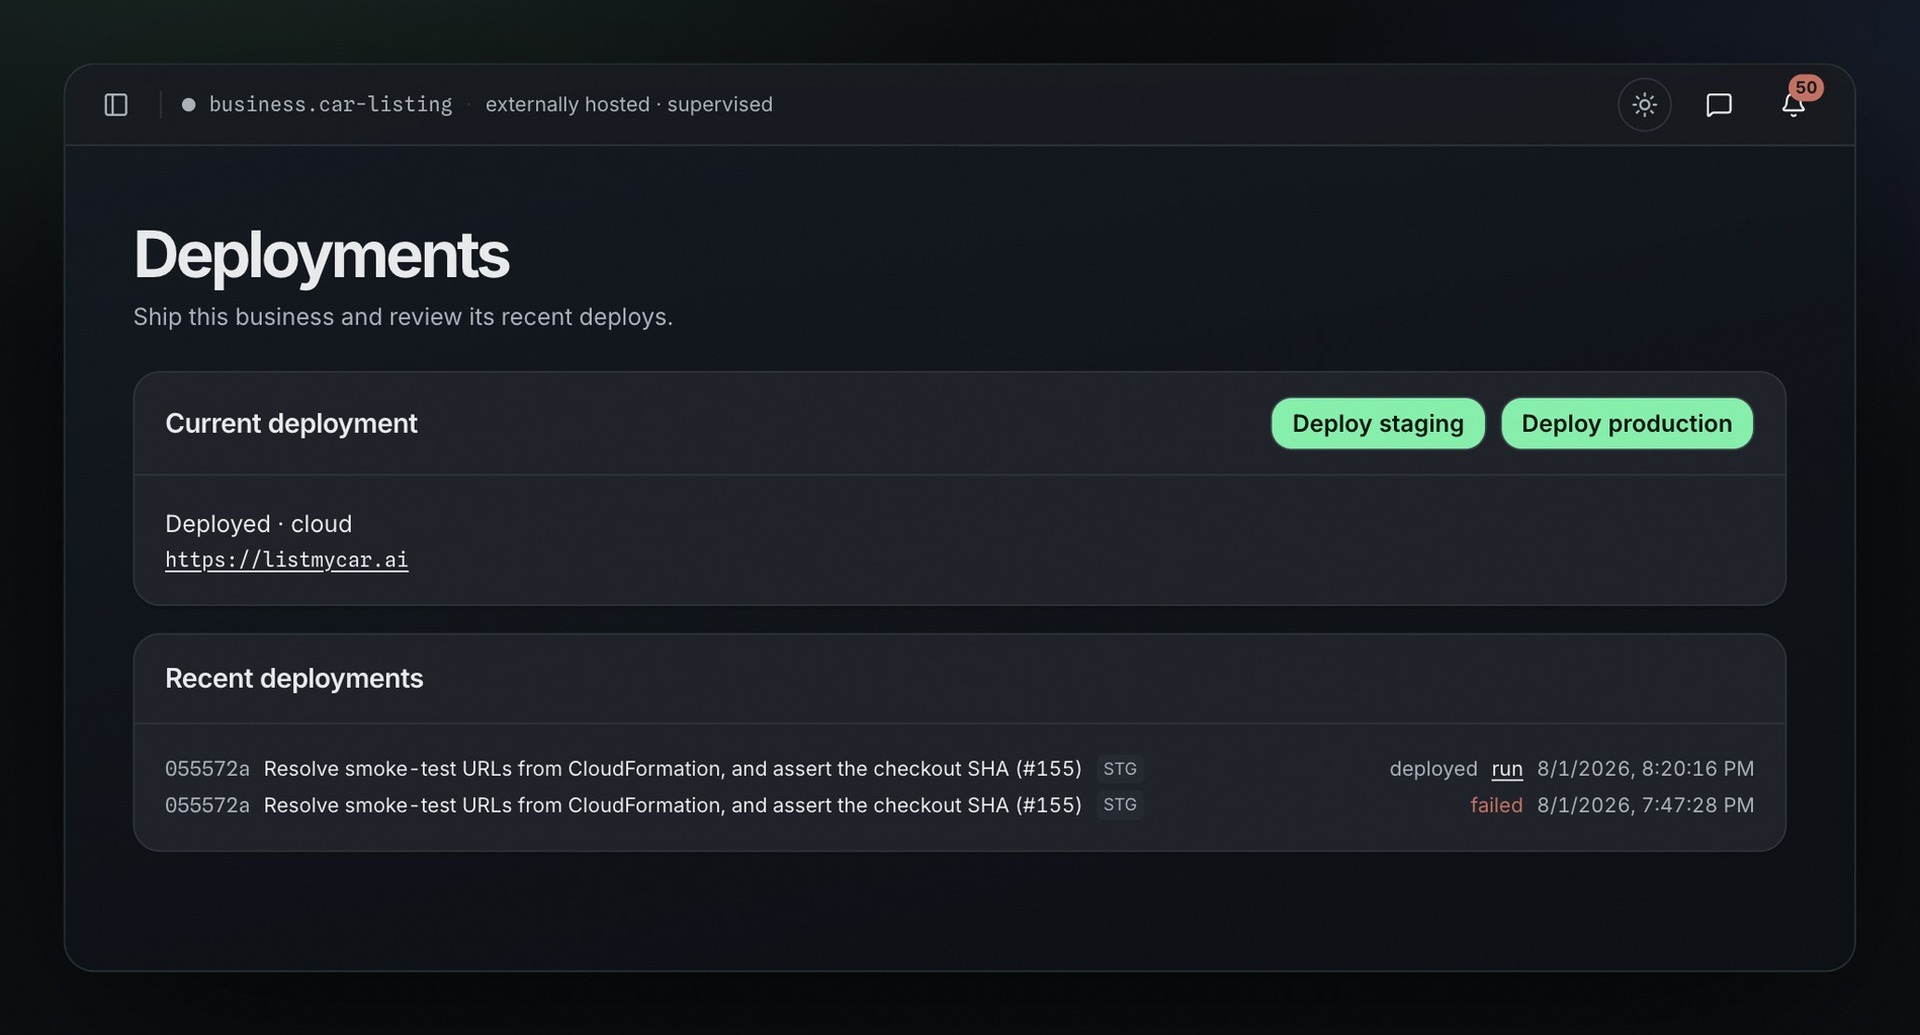 A failed attempt remains visible beside the successful deployment, preserving the operating record instead of replacing it with the final green state.
During the April-through-August 2026 case-study period, Solo's business overview showed 99.87% uptime and zero current errors for the captured window. That is a dated observation, not an uptime promise. The reusable lesson is to keep reliability beside releases and customer activity so a team can see what changed, whether the customer path recovered, and what the incident cost.
Read the complete delivery and recovery loop in how Solo runs ListMyCar.ai.
Where Solo fits
This is the part Solo was built to take.
Solo scaffolds the operating foundation as part of creating the business: managed Postgres, AWS deployment, HTTPS on your domain, health checks, and alarms. It then runs monitoring and incident triage continuously, surfacing decisions that need a person rather than every metric change.
The stack is deliberately ordinary: Next.js, FastAPI, Postgres, AWS, infrastructure defined as code in a repo you own. Nothing proprietary in the runtime, and if you want to take it and run it yourself, you can.
The checklist above, done on day one, and then kept current. Solo handles deploys, monitoring, alerting, and incident triage so recurring operations stop competing with your product. Join the waitlist →